Spatial patterns of grazing near patch reefs in Belize: Satellite and ‘in situ’ metrics
Spatial patterns of grazing near patch reefs in Belize: Satellite and in situ metrics
Bartholomew DiFiore MESc1
Abstract
Grazing halos—barren areas of sand that surround coral patch reefs in otherwise continuous seagrass plains—form due to predator avoidance by herbivorous fish and echinoderms that preferentially graze seagrasses close to the safety of the reef structure. Grazing halos are readily visible from satellite and aerial imagery and halo size may be indicative of local predator abundance. This study analyzed grazing patterns in the South Water Caye Marine Reserve (Belize) using remote sensing techniques and field surveys. Eight patch reefs were analyzed within a no-take conservation zone and fished zones. At each patch reef herbivore behavior was determined using grazing assays deployed along transects from the reef edge, while metrics of grazing halo extent were determined using satellite imagery. Grazing pressure was found to decrease with distance from the reef refuge. Furthermore, grazing was greater in no-take areas and decreased more rapidly with distance from the reef edge when compared to similar fished sites. Grazing in situ was significantly higher inside of grazing halos when compared to outside halos. On average, 92.4±12 % of the grazing that did occur was located inside of the halo boundary. This study provides novel evidence of differences in the spatial pattern of grazing between protected and fished sites. It also provides direct support for the efficacy of using satellite imagery to monitor grazing patterns at patch reefs.
Halos de pastoreo (‘grazing halos’) son zonas de arenas descubiertas que rodean parches de arrecifes coralinos en medio de praderas de hiervas marinas. Estos halos se forman por la herbívora de peces y equinodermos que usan los arrecifes para refugiarse de los depredadores y se alimentan de las hiervas marinas, cercanas a los arrecifes. Los halos de pastoreo son fáciles de reconocer a partir de imágenes satelitales y fotografías aéreas, y su tamaño puede correlacionarse con la abundancia de depredadores. Este estudio analizó patrones de pastoreo en halos localizados en la Reserva Marina de South Water Caye (Belice) utilizando técnicas de detección remota y verificación en campo. Se estudiaron ocho parches de arrecifes localizados en una zona de conservación que incluye áreas de pesca libre y áreas de pesca restringida. En cada parche se determinó la intensidad de la herbivoría utilizando transectos de pastoreo desde el borde del arrecife, y el tamaño de los halos fue determinado mediante imágenes satelitales. Se encontró que el pastoreo disminuye a medida que la distancia desde el arrecife incrementa. Además, el pastoreo fue mayor en las áreas con pesca restringida y disminuyo más rápidamente con relación a la distancia desde el arrecife, que en sitios sin restricciones de pesca. El pastoreo in situ fue significativamente mayor dentro de los halos que al exterior de estos. En promedio, 92,4±12% del pastoreo se localizo dentro del perímetro de halo. Este estudio proporciona nuevas evidencias sobre los patrones espacial de pastoreo entre sitios de pesca y con pesca restringida en halos de pastoreo. También demuestra la eficacia de imágenes satelitales para estudiar los patrones de pastoreo en los parches de arrecifes.
Introduction
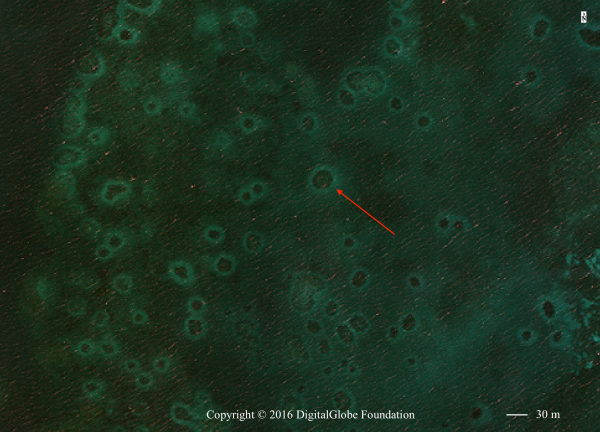
Grazing zones are conspicuous features of the coral reef landscape and can be found throughout the back reef lagoons of coral reefs in Australia, the Caribbean, Indonesia, and the Red Sea. Grazing zones are denuded substrate surrounding patch reefs in shallow waters formed as a result of herbivores foraging close to the protection of the patch reef (Randall 1965, Ogden et al. 1973). Due to their appearance when viewed in areal or satellite imagery (Fig. 1), researchers often call these zones grazing “halos” (Ogden et al. 1973). Despite their ubiquity, the factors that control grazing zone size are largely unknown. Researchers generally accept that grazing halos represent a behavioral response of herbivores to the risk of predation (Valentine et al. 2007, Madin et al. 2011, Downie et al. 2013), but there is little empirical evidence confirming this hypothesis. Theoretically, grazing distance must represent some tradeoff between competition amongst herbivores, the risk of predation, and the quality of the refuge habitat.
Recently, Madin et al. (2011) proposed the use of satellite imagery to indirectly estimate local predator abundances based on the size and extent of grazing halos. If possible, this method would allow managers to remotely monitor predator abundances in hard to access coral reef environments using only satellite metrics. To test such a methodology, however, it is first necessary to confirm the relationship between satellite-derived measures of grazing halo extent and grazing by herbivores in situ.
Herbivory is a critical in maintaining the balance between hard coral and macroalgae substrate in coral reef ecosystems (Adam et al. 2015). Quantifying herbivory has been one of the long-standing aims of coral reef research. Yet very few studies have examined the spatial distribution of grazing in relation to isolated, refuge habitats; the few studies that do often only quantify grazing at a limited number of discrete distances (Valentine et al. 2007, 2008, Downie et al. 2013), and not at higher resolutions closer to the refuge (Ogden et al. 1973, Madin et al. 2011, for exceptions). This study sought to quantify herbivory throughout grazing halos surrounding patch reefs in Belize. Specifically, we attempted to address two questions:
-
How does grazing vary with distance from the reef refuge? Does this relationship change inside and outside of the no-take conservation zone?
-
Can satellite images be used to accurately quantify grazing patterns near patch reefs?
This analysis represents a portion of the author’s broader study that examines how fish community structure and refuge quality affects grazing distance.
Methods
Study site
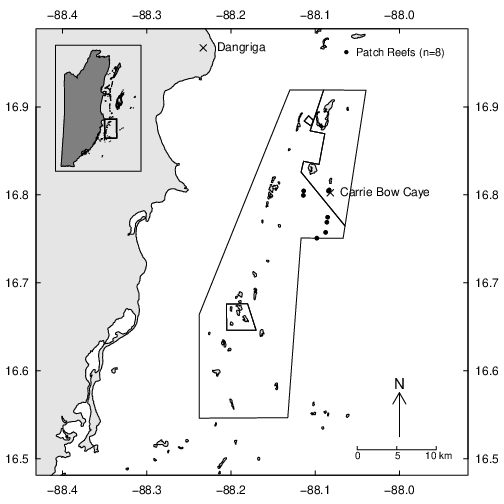
This study was conducted at the Smithsonian Institution’s field station, Carrie Bow Caye, Belize (16°48.154’ N, 88°4.915’ W), a small islet located 20 km southeast of Dangriga, Belize, on the seaward edge of the Meso-American Barrier Reef. The station is situated within the Southwater Caye Marine Reserve that was established in 1996 as a Belize Barrier Reef Reserve System World Heritage Site. In 2009 Belizean managers implemented a no-take conservation zone that prohibits commercial fishing over the northwest portion of the Southwater Reserve (Fig. 2). The reserve’s lagoon ranges from 1–20 m in depth and consists of sand flats and seagrass plains (predominantly Thallasia testudinum Banks ex König [Hydrocharitaceae]), punctuated by numerous patch reefs of various size (>5 m2 to <1 km2). The patch reefs vary from low-relief rubble aggregates dominated by gorgonian fan corals, to highly complex reef structures dominated by branching and massive coral types.
We conducted fieldwork on eight patch reefs, two inside of the conservation, no take zone, and six within fished portions of the broader marine reserve. We selected shallow water patch reefs based on the continuity of grazing halos, accessibility, and depth (<7 m). We conducted all fieldwork using mask, snorkel and fins in June, 2017.
Grazing assays
We assessed the distance herbivorous fish and echinoderms grazed from the reef edge using grazing assays similar to those conducted in Hay et al. (1981), Madin et al. (2011), and Valentine et al. (2007). We controlled for variation in seagrass nutritional quality by collecting T. testudinum blades from seagrass beds near each patch reef. Each seagrass blade was cut to 7 cm, photographed, clipped to weighted clothespins, and deployed immediately along three randomized transects extending from the reef edge, with two clips placed every 2 m from 0–20 m. We re-photographed each blade after 24 hours and calculated the loss in blade area by comparing blade area before and after deployment using ImageJ software (Schneider et al. 2012).
Satellite-derived metrics of grazing
Using satellite imagery we calculated the halo extent for each grazing zone as the average distance from the patch edge to the edge of the grazing halo. Using ArcGIS, we manually delineated reef edges and halos, converted the shapefiles to densified point clouds, and calculated the average minimum distance from the reef to the halo edge. Grazing halos can appear diffuse or noncontiguous in the satellite imagery. We approximated the outside of the halo as the line of maximum transition from sand to seagrass, connecting between definitive points if the halo was not continuous. We determined halo dimensions for 7 of 8 patches using a high-resolution image captured by the GeoEye-1 sensor in 2015. Clouds obscured the remaining patch and we analyzed the halo using a 2009 World View 2 scene. All imagery was provided by the DigitalGlobe Foundation.
In order to validate the spectral signature of grazing, we took photos of a 0.25 m2 quadrat laid on the substrate along transects extending from the patch edge. We analyzed the photos using Coral Point Count software (Kohler and Gill 2006) and determined seagrass percent cover with distance from the patch. The analysis of substrate photographs is ongoing and only one patch reef has been completed.
Data analysis
Prior to analysis of the grazing data we visually inspected each blade for evidence of bites, and we only allowed blades with obvious signs of grazing to present a change in area. Variation in unbitten blade size before and after deployment was low (2–4%), and we attributed it to inaccuracies in the blade image analysis. A pair of blades at each distance along a transect was treated as the sampling unit (n = 252). We calculated the proportion grazed (Ygraze) as:
,
where BladeA and BladeB are the blade areas, at time0 (before placing out in the transects) and time1 (following collection).
The data were zero-inflated due to the large number of assays that were not grazed. We used both linear regression with logit transformations and logit beta regression to analyze the relationships between grazing, distance, and protection status. Due to the non-normal distribution of the data even with a logit transformation, beta regression of the non-binomial proportion data seemed the best methodology available. We used Mann-Whitney tests to see if there was a difference in the mean grazing proportion between no-take and fished sites. All statistics were computed in R version 3.3.1 (R Development Core Team, 2013).
In order to test the accuracy of using satellite images to monitor grazing patterns, we thresholded the grazing at each patch to the satellite-derived measure of mean halo extent for that patch. Then we calculated the proportion of the change in blade area both inside and outside of the halo boundary. We used Wilcoxon signed rank tests to determine differences in mean in situ grazing in relation to the halo boundary. One patch reef was dropped from the analysis as the halo was indiscernible in satellite imagery. To confirm the efficacy of the satellite images in sensing change in seagrass coverage across the halo zone, we used linear regression to test for differences in satellite reflectance and seagrass cover.
Results
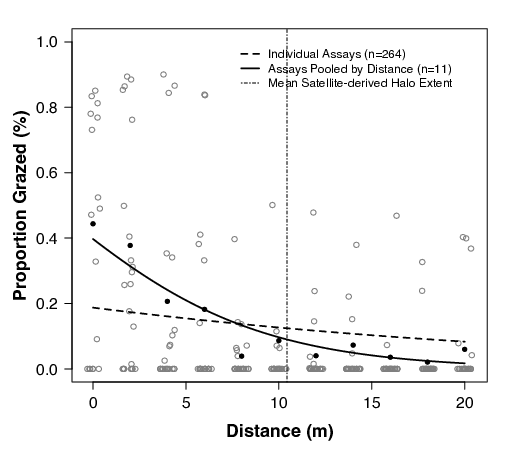
Across all patches, herbivores grazed 10.3±22.5% (mean±SD) of the area of each deployed assay (n = 262) and 31.8% of assays had evidence of grazing. We did find distinct patterns in the spatial distribution of grazing with more than 50% of grazing occurring within 2 m of the reef edge and 85% occurring within 10 m. Using beta regression models, we found that grazing decreased significantly with distance (Fig. 3). The relationship was different depending on if the data were treated as individual assays (pseudo R2 = 0.16, p < 0.001) or pooled as the proportion of grazed blade area at each distance (pseudo R2 = 0.73, p <0.001). Simple logit regression of the individual assays did not find a significant negative relationship between grazing and distance (p = 0.29), but the logit transformation did not normalize the data’s distribution.
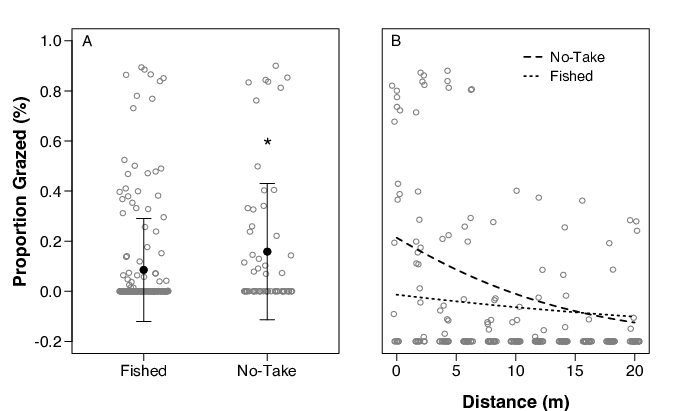
Grazing differed significantly between the no-take patches and nearby, similar fished patches (Fig. 4A). Of the area of seagrass deployed, 17.7% was grazed in no-take areas, while 11.6% was grazed in fished zones. Herbivory was more intense closer to the reef edge and declined faster than fished patches (Fig. 4B).
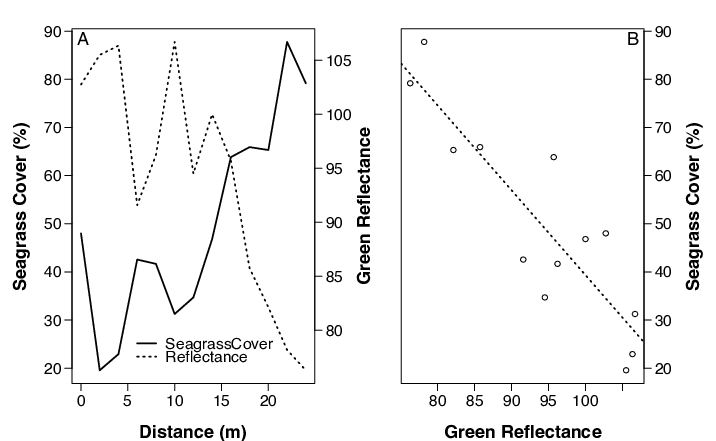
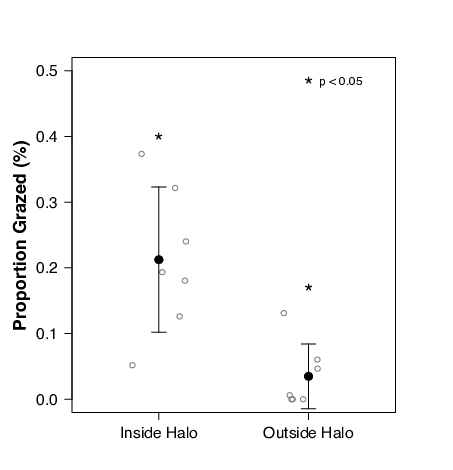
Our initial evaluation of seagrass coverage throughout the grazing halo has revealed that seagrass coverage increases with distance from the reef edge while satellite reflectance values decline along the same transect at one patch reef (Fig. 5a) Seagrass coverage and reflectance were negatively related (Fig. 5b; linear regression, R2 = 0.78, p < 0.001). When the grazing results at each patch were categorized as either “inside” or “outside” of that patch’s respective mean grazing halo width (satellite-derived), we found that the proportion grazed inside (21.2±11%) was significantly greater than the portion grazed outside (3.5±5%) of the halo threshold (Fig. 6). Of the grazing that did occur, on average 92.4 % occurred within the halo boundary, as compared to only 7.6% outside of the boundary.
Discussion
Herbivory is a critical, top-down driver of heterogeneity in biogenic habitats including coral reefs (McClanahan et al. 2011) and seagrasses (Heithaus et al. 2012). Despite its importance, the preponderance of research has focused on herbivory within the reef structure itself, rather than as a function of distance from the reef refuge. Back reef zones host a variety of different habitats in close proximity, including seagrass and/or macroalgae plains, sand flats, coral rubble, and patch reefs. Fish communities in the back reef zones are known to move between these different habitats promoting cross-habitat nutrient subsidies (Valentine et al. 2008). Therefore, it is critical that we understand the spatial distribution of grazing from refuges, as it both directly (via herbivory) and indirectly (via cross-habitat subsidies) influences biogenic habitat.
In this study we found strong evidence that grazing decreases with distance from patch reefs in the South Water Cay marine reserve in Belize. This finding verifies our hypothesis and is consistent with similar studies of grazing zones in Australia (Madin et al. 2011), the U.S. Virgin Islands (Randall et al. 1965, Ogden et al. 1973), and the Florida Keys (Valentine et al. 2008). To date, however, researchers have little understanding of the factors driving the spatial variation in grazing and how this variation may differ between geographically distinct coral reef/seagrass ecosystems. The spatial extent of grazing must represent some trade-off between: 1) resource availability on the reef refuge, 2) competition amongst the local herbivore guild, 3) the risk of predation, 4) the quality of the reef refuge, 5) predation strategy, 6) the herbivore and predator size class distribution, and 7) the nutritional quality of the surrounding substrate. The current analysis is part of a larger study examining the interplay of these factors on the spatial distribution of grazing near patch reefs.
Interesting, this study provides some of the first evidence of differences in herbivory within the grazing zone between no-take protected sites and fished sites. We found that grazing was higher in no-take areas and decreased more rapidly with distance from the reef edge (Fig. 4b). In fished zones grazed was lower on average and decreased slowly in a linear fashion. No-take protected zones in other geographic locations have been shown to increase piscivore and herbivore populations (Valentine et al. 2007), although this pattern is not universal and often contested. A variety of factors may have caused the grazing patterns to differ between fished and unfished areas. Our study was limited to only two patch reefs within the protected zone and may not have captured the true variability in grazing patterns. Ecologically, grazing may have been higher inside of the protected zone due to a greater abundance of large herbivores. Large herbivores, like mature parrotfish, often attain sizes that afford an escape from common reef associated predators (Kramer and Heck 2007). The rapid decline in grazing with distance in no-take sites compared to fished reefs, however, suggests that there may be a greater risk of predation within the protected area. Smithsonian researchers familiar with the site have not seen dramatic increases in predator populations inside the conservation area and say that illegal fishing is a factor (V. Paul, personal communication). The effect of differences in fish community structure on grazing patterns remains to be directly tested. Our data does provide initial evidence to support the hypothesis that the risk of predation may be greater inside the protected area.
Our findings confirmed the efficacy of using satellite imagery to monitor grazing surrounding patch reefs. When the satellite-derived measures of halo extent were imposed on the grazing data we found that the majority of grazing occurred within the halo extent. Furthermore, the spectral reflectance in the images was correlated with changes in seagrass coverage as you moved away from the reef edge. Together, these findings suggest that satellite imagery can be used to accurately predict halo width around patch reefs. Such evidence confirms the legitimacy of using satellite imagery to monitor grazing patterns at larger spatial scales.
Acknowledgements
This project was only possible through the generous support of the Tropical Resources Institute, the Link Foundation, the Yale School of Forestry and Environmental Studies, the David Schiff Fund, and the Digital Globe Foundation. I would like to particularly thank my research advisors: Dr. Simon Queenborough (Yale), Dr. Liza Comita (Yale), Dr. Valerie Paul (Smithsonian Institute), Dr. Mary Beth Decker (Yale), and various research assistants: Audrey Looby (Smithsonian), Trent Hodges, Simon Thomas-Train, Terry Petronzio, and Luke DiFiore
References
Adam, T.C., D.E. Burkepile, B.I. Ruttenberg, and M.J. Paddack. 2015. Herbivory and the resilience of caribbean coral reefs: Knowledge gaps and implications for management. Marine Ecology Progress Series 520, 1–20. doi:10.3354/meps11170.
Downie, R.A., R.C. Babcock, D.P. Thomson, and M.A. Vanderklift. 2013. Density of herbivorous fish and intensity of herbivory are influenced by proximity to coral reefs. Marine Ecology Progress Series 482, 217–25. doi:10.3354/meps10250.
Hay, M.E. 1981. Spatial Patterns of agrazing intensity on a caribbean barrier reef: Herbivory and algal distribution. Aquatic Botany 11, 97–109. doi:10.1016/0304-3770(81)90051-6.
Heithaus, M.R., A. J. Wirsing, and L. M. Dill. 2012. The ecological importance of intact top-predator populations: A synthesis of 15 years of research in a seagrass ecosystem. Marine and Freshwater Research 63, 1039. doi:10.1071/MF12024.
Kohler, K.E. and S.M. Gill, 2006. Coral Point Count with Excel extensions (CPCe): A Visual Basic program for the determination of coral and substrate coverage using random point count methodology. Computers and Geosciences 32, 1259–1269. doi:10.1016/j.cageo.2005.11.009.
Kramer, Kl, and Kl Heck. 2007. Top-down trophic shifts in Florida Keys patch reef marine protected areas. Marine Ecology Progress Series 349, 111–23. doi:10.3354/meps07083.
Madin, E.M. P., J.S. Madin, and D.J. Booth. 2011. Landscape of fear visible from space. Scientific Reports 1. doi:10.1038/srep00014.
McClanahan, T.R., N.A. Muthiga, and R. A. Coleman. 2011. Testing for top-down control: Can post-disturbance fisheries closures reverse algal dominance? Aquatic Conservation: Marine and Freshwater Ecosystems 21, 658–75. doi:10.1002/aqc.1225.
Ogden, J.C., R.A. Brown, and N. Salesky. 1973. Grazing by the echinoid Diadema antillarum Philippi: Formation of halos around West Indian patch reefs. Science 182, 715–717.
Randall, J.E. 1965. Grazing effect on sea grasses by herbivorous reef fishes in the West Indies. Ecology 46, 255–260.
Reef Life Survey. 2015. Standardized Survey Procedures for Monitoring Rocky and Coral Reef Ecological Communities. Retrieved from http://reeflifesurvey.com/wp-content/uploads/2015/07/NEW-Methods-Manual_…
R Core Team. 2013. R: A language and environment for statistical computing. R Foundation for Statistical Computing, Vienna, Austria. URL http://www.R-project.org/.
Schindelin, J., I. Arganda-Carreras, and E. Frise, et al. 2012. Fiji: an open-source platform for biological-image analysis. Nature Methods 9, 676–682.
Valentine, J.F., K.L. Heck, D. Blackmon, M.E. Goecker, J. Christian, R.M. Kroutil, K.D. Kirsch, B.J. Peterson, M.Beck, and M.A. Vanderklift. 2007. Food web interactions along seagrass-coral reef boundaries: Effects of piscivore reductions on cross-habitat energy exchange. Marine Ecology Progress Series 333, 37–50.
Valentine, J.F., K.L. Heck, D. Blackmon, M.E. Goecker, J. Christian, R.M. Kroutil, B. J. Peterson, M.A. Vanderklift, K.D. Kirsch, and M.Beck. 2008. Exploited species impacts on trophic linkages along reef-seagrass interfaces in the Florida Keys. Ecological Applications 18, 1501–1515.
-
Bart DiFiore is a second year Master of Environmental Science candidate at the Yale School of Forestry and Environmental Studies. He is from the coastal town of Gloucester, Massachusetts, and holds BA degrees in English and Biology from Middlebury College. His research focuses on the factors that drive the spatial distribution of grazing at coral patch reefs. He will be starting a PhD in marine ecology at the University of California Santa Barbara in 2017.↩