Quantitative differentiation of color morphology in the colonial coral ‘Montipora capitata’
Quantitative differentiation of color morphology in the colonial coral Montipora capitata
Caroline Hobbs, MEM1, Dennis Conetta2, Carlo Caruso3, Mariana Rocha de Souza4, Ruth Gates5
Abstract
Color is an intuitive indicator of phenotype for a biologist or ecologist in their study of species adaptation and evolution, and simultaneously is one of the fastest-learned species identification tools for the citizen scientist. Quantifying color reliably and differentiating between morphs (in a consistent and rigorous manner) strengthens the validity of any scientific experiment or morph identification. Inconsistent identification of color may result in imprecise conclusions within studies and poor linkages amongst studies in a given body of knowledge. In this paper, we look at two subjectively differentiated color morphs of the pacific coral Montipora capitata and assess the quantitative difference between those identified as ‘Orange’ and as ‘Brown’. We found that ‘Orange’ coral morphs occupied significantly different RGB color space than corals qualitatively identified as ‘Brown’ morphs. The results of this study will directly inform further research on M. capitata’s colormorphs and their stress response to light, allowing us to consider separate physiological responses of ‘Brown’ versus ‘Orange’ phenotypes.
Introduction
Throughout their life cycle, biological organisms are exposed to a wide variety of stressors, including external attack (or fear of attack) by predators, herbivores, or disease, a critical lack of resources (e.g., drought or shade), and even excess of a resource or condition (such as temperature or CO2) (Gibson et al. 2011). These stressors can have distinct effects on specific organisms. In particular, because sessile organisms such as plants and corals do not have the immediate option to move away from stressors, they have evolved a range of internal responses to attempt to alleviate or adapt to stress (Menge et al. 1987; Nevo et al. 2001). Corals—marine invertebrates that contain photosynthetic dinoflagellates that live symbiotically within their tissues—appear particularly susceptible to abiotic stressors. These stressors include variation in ocean temperature, light levels, and CO2 concentration, all of which are exacerbated by anthropogenic climate change (Brown et al. 1985). The ability to directly assess coral stress would allow us to estimate the severity of climate change impacts on marine ecosystems.
The overall expression of color in a coral is thought to be a combination of protein florescence (determined by genetic make-up) in the coral host and the community composition of functionally diverse dinoflagellates, Symbiodinium, present in a coral’s tissue at a given time. Distinct color morphs of various coral species have been identified qualitatively and used to study coral’s varying epigenetic responses to stressors such as bleaching and disease (Innis et al. 2018, Shore-Maggio et al. 2018). The dominance of a specific clade of Symbiodinium found in a coral at a given time (and the consistency of this community make-up over time) may also help us to identify and predict coral colonies’ response to environmental changes or stress (Innis et al. 2018). While within-species color morphs are distinct from one another based on their color differences (which may be understood as their phenotypic expression), color change is also a clear indication of a stressor (to which different morphs have been shown to respond differently; Innis et al. 2018, Shore-Maggio et al. 2018). In white band disease, a distinct white band is visible around the coral in contrast to surrounding pigmented tissue (Aronson et al. 2001), while in coral bleaching, tissue changes from deep browns to pale browns and eventually to white in response to heat-induced stress. These color changes are attributed to Symbiodinium loss.
Thus, at any given time, coral color and coral color change can be partially attributed to Symbiodinium density and partially attributed to the interaction of the dominant clade of Symbiodinium and genetic make-up of coral host. With a stronger understanding of color expression and clearer identification of the morphs in question, coastal management and restoration efforts could be finely tailored to aid the health of reef building species like Montipora capitata. Further, the study of coral color morph shows great promise in the attempt to better understand coral epigenetics, resilience, and potential for short term adaptation (Putnam et al. 2016). This may include increased accessibility to the citizen scientist and even an easily identifiable measure of ecosystem resilience potential in a reef community.6
Montipora capitata Dana. (Acroporidae) is a scleractinian Indo-pacific reef-building coral, common in Hawaiʻi, which exists as two distinct color morphs (Innis et al. 2018, LaJeunesse et al. 2004, Shore-Maggio et al. 2018). These two morphs have been identified clearly but have yet to be quantitatively or consistently characterized. For example, the two morphs are referred to as ‘Red’ and ‘Orange’ morphs by Shore-Maggio et al. (2018), and ‘Brown’ and ‘Orange’ morphs by Innis et al. (2018), where ‘red’ and ‘brown’ probably refer to the same morph. This labeling mismatch may create confusion and highlights the need for a proven, quantitative and consistent, identification system to define the color morphs of Montipora capitata. Confirming that the two morphs are reliably different will create a rigorous backing for future study of coral color morphology and for progress made previously with reference to color morphs of Montipora capitata.
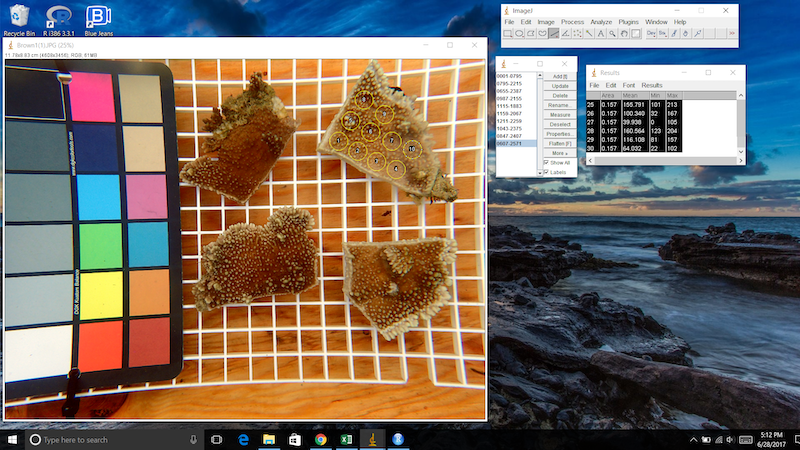
In this study we attempted to quantitatively differentiate between the two apparent color morphs. Using the imaging software ImageJ (Schneider et al. 2012) we standardized the objective color space (red-green-blue, RGB) to quantify the color of the experimental fragments which were preliminarily identified as ‘Brown’ or ‘Orange’ colonies. These experimental fragments were photographed over a ten-week period to track each color morph’s response to varying depth (light by proxy) treatments.
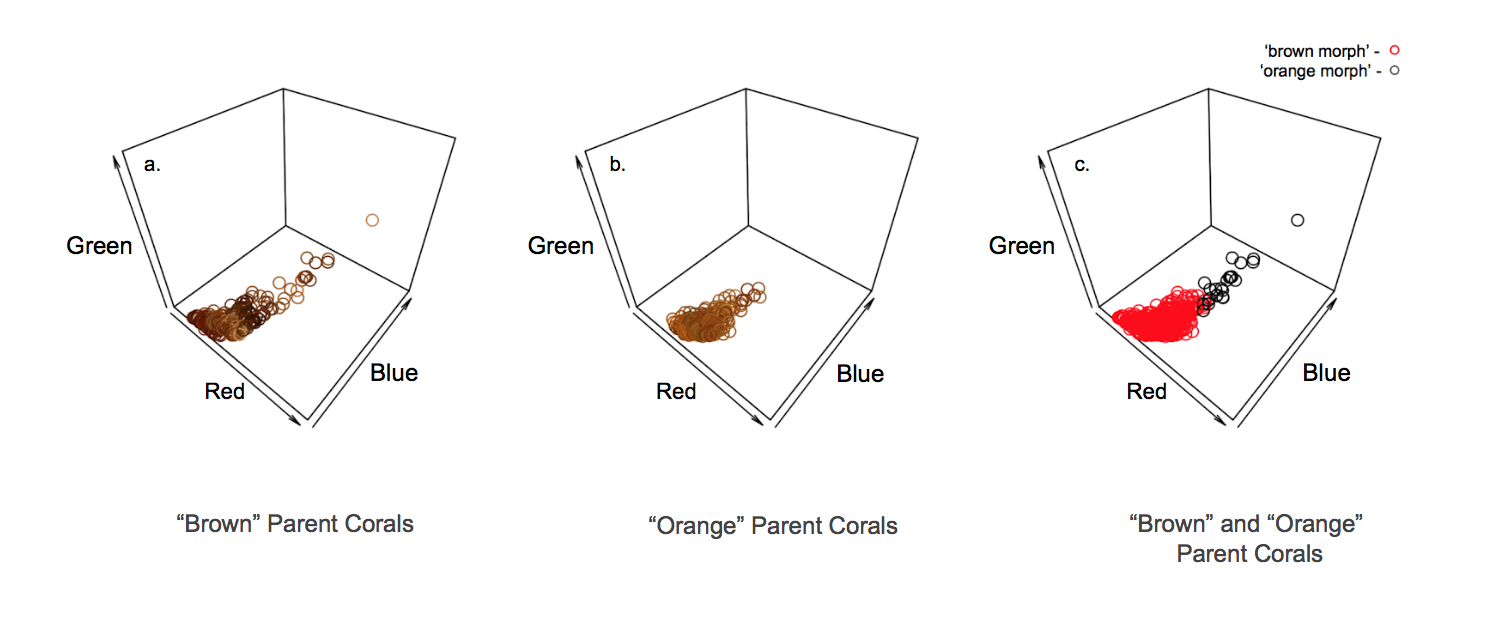 Figure 1. Parent coral color in 3D RGB space. (a). The distribution in 3D RGB color space of ‘brown’ parent corals (n = 240) at time point = 0. Points are the color of the data they represent and lie in that RGB space. (b). The distribution in 3D RGB color space of ‘orange’ parent corals (n = 240) at time point = 0. Again, points are the color of the data they represent and lie in that RGB space. (c). The distribution in 3D RGB color space of ‘brown’ and ‘orange’ parent corals (n = 240) at time point = 0 represented by red and black points respectively.
Methods
Study site
Kaneohe Bay, Hawaiʻi (21.4282° N, 157.7919° W) is a eutrophic ecosystem, characterized by patchy reef flats dominated by Montipora capitata Dana. (Acroporidae) and Porites compressa Dana. (Poritidae) (Cox et al. 2006, Jokiel 1987, Shore-Maggio et al. 2018).
Sampling
Thirteen medium sized, plating growth-form Montipora capitata parent corals were chosen for this study. These corals were obtained from a floating coral nursery, which consisted of colonies of opportunity that had been rescued from a construction site. The parent colonies collected for this study were kept at a consistent depth of 6 ft. for two weeks before being chosen; six of these were qualitatively identified as ‘Brown’ morph parent colonies and seven qualitatively identified as ‘Orange’ morph parent colonies. These 13 parent corals were each cut with a diamond cutter into four pieces and those pieces were glued onto plugs to be placed on crates we created for four treatment groups (all within the nursery): shallow (3 ft. depth), control (6 ft. depth), deep (9 ft. depth), and shade (6 ft. depth shaded by a netted platform). Each of the original 13 parent colonies were photographed such that all four of the fragments that made up each colony were photographed next to a color card, at a fixed depth, with a camera mount we designed and built to minimize color distortion.
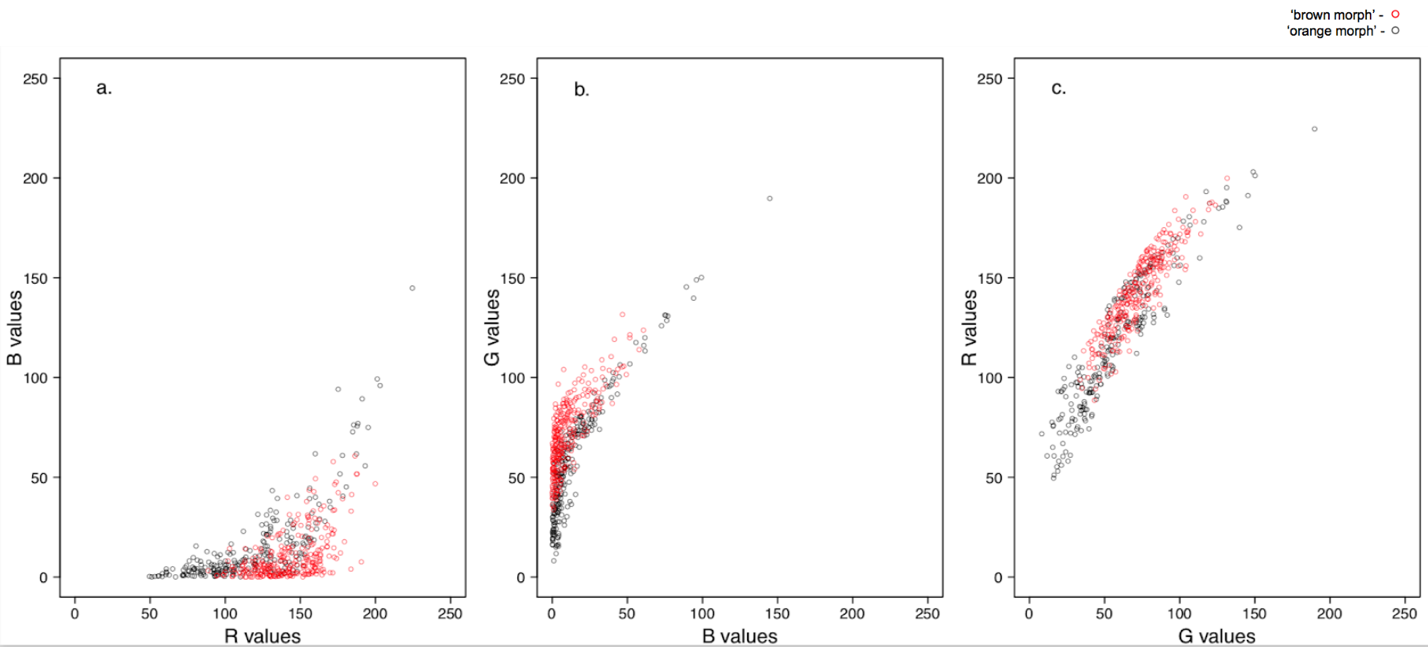 Figure 2. Parent coral color in 2D space. The distribution in 2D color space of ‘brown’ (n = 28) and ‘orange’ (n = 24) parent corals at time point = 0, represented by red and black points respectively.
Color data analysis
We used ImageJ v. 1.51 (Schneider et al. 2012) to extract the RGB color values (Appendix A). Each photograph was color corrected using an ImageJ plug-in which corrected the photo to the true values of black and white using the gray scale on the color card. From each corrected image, we sampled 10 circular regions 175 pixels in diameter and calculated a mean RGB color value for each region. To test that our subjective assignment of ‘Brown’ versus ‘Orange’ color morph was consistent with RGB color space, we first plotted each fragment in 3D RGB space and then in 2D color space. Then we modeled two of the three colors in turn, for example green as a function of red, then red as a function of blue, then blue as a function of green, using linear mixed effects models. We ran two models for each combination of colors, with and without parent morph color, and compared the two models using ANOVA to test for a significant effect of morph color (Bolker et al. 2009). We have multiple color samples from each coral fragment and have thus set the random effect in all models to be “fragment”.
Results
As we hypothesized, the objective RGB color space showed a clear differentiation between ‘Brown’ and ‘Orange’ color morphs (Fig. 1 & 2). Further, in all three tests of one color on another, the model that included parent color was significantly different from the model without parent color. We see this in all three ANOVA models. Models 1 and 2, which look at red and blue values with and without parent coral color accounted for (χ2 = 28.9, df = 2, n = 240, p < 0.001), models 3 and 4, which look at green and blue values with and without parent coral color accounted for (χ2 = 162.9, df = 2, n = 240, p < 0.001), and models 5 and 6, which look at green and red values with and without parent coral color accounted for (χ2 = 213.7, df = 2, n = 240, p < 0.001). These results indicate that the models that included color as a variable were significantly more representative of the data than the models that did not include color. These results support our hypothesis that parent color was objectively different between the two morphs (Table 1).
Discussion
In this paper we have attempted to quantitatively differentiate between ‘Brown’ and ‘Orange’ color morphs of the Pacific reef building coral, Montipora capitata. We see that coral color morphs qualitatively selected and observed in the field, can be quantitatively differentiated in RGB space. This process has exemplified a color differentiation methodology which may be utilized broadly (especially in the field of biology), creates a basis for phenotypic comparison within and among corals, and identifies a potential pathway for citizen science to incorporate a measure of reef community resilience.
| Model | Model Equation | ANOVA |
|---|---|---|
| R ∼ B + Color | B: y = 0.87x + 104.6 O: y = -0.06x + 28.6 | χ2 = 21.88, df = 2, p < 0.001 |
| R ∼ B | y = 0.085x + 119.9 | |
| B ∼ G + Color | B: y = 0.84x – 31.0 O: y = - 0.14x – 5.916 | χ2 = 162.98, df = 2, p < 0.001 |
| B ∼ G | y = 0.79x – 36.14 | |
| G ∼ R + Color | B: y = 1.10x – 67.4 O: y = - 0.16x + 11.33 | χ2 = 213.65, df = 2, p < 0.001 |
| G ∼ R | y = 1.03x – 64.44 |
Clear differentiation between color morphs within a species creates potential for comparison over time that may help us identify mechanisms behind short-term adaptation to stressors based on coral-Symbiodinium partnerships and subsequent color expression. Without a quantitative difference in morphs, the ambiguity of morph identification creates significant margin for error in analysis of color, color change, and therefore also in analysis of phenotypic plasticity and adaptation. This is especially true considering the “shuffling” (Innis et al. 2018) of symbiont communities within a coral which alludes to potential for movement along a spectrum of color expression as the result of Symbiodinium community make-up at any given time; This may be both due to the highly diverse morphologies represented across the genus Symbiodinium and due to the varying timescales at which Symbiodinium community make-up may evolve in a given coral i.e., genetic make-up and potential for adaptation of the coral and symbiont community.
There is a significant amount of error incurred in a number of the aspects (arguably all aspects) of this color differentiation process, which is compounded by error present in areas flawed by inherent human biases. We attempted to minimize error throughout this process but recognize there is always room for improvement minimizing color identification error. We were forced to assign color-morph boundaries more or less arbitrarily. Ideally future methodology can be developed to define standardized and distinct RGB boundaries for categorizing color-morphs. Our hope is that a more rigorous, collaborative, and consistent color differentiation processes/technology will continue to develop within and beyond biology.
There is a communication gap between scientists, managers, and citizens all impacted by and impacting coastal health that creates detrimental inefficiencies in conservation and development efforts. A stronger understanding of coral biology (and subsequently increased potential for improved coastal health) will come from exploration of color morphs and their relationship to changing environments. This exploration cannot be justified without definition and differentiation of color morphs. With the interest around color morph as an indicator of Symbiodinium community make up (Innis et al. 2018) and maybe even as an indicator of a colony’s ability to adapt to a given environment (Putnam et al. 2016), it is imperative that the language used to address these morphs is consistent and accessible. We have attempted to provide a clearly defined and consistent protocol to allow both the scientist and the citizen scientist to quantitatively differentiate between color morphologies. This protocal is a precursor to specifically identifying and labeling a color morphology.
We hope that with this basis of color differentiation, collaborative and consistent color identification processes, which enhance the baseline for epigenetic understanding and improve the effectiveness of marine management strategies, will continue to emerge.
Acknowledgements
This project was supported by the Tropical Resources Institute at Yale, the Hawaii Institute of Marine Biology, Northeastern University’s Three Seas Program, and the Yale School of Forestry and Environmental Studies. We would like to thank Simon Queenborough, Andrew Muehleisen, Beth Lenz, and Chris Wall for their support and consulting.
References
Abrego, D., Ulstrup, K., Willis, B., & van Oppen, M. 2008. Species-specific interactions between algal endosymbionts and coral hosts define their bleaching response to heat and light stress. Proc R Soc B 275, 2273–2282.
Aronson, R.B. & Precht, W.F. 2001. White-band disease and the changing face of Caribbean coral reefs. In: Porter, J.W. (Ed.) The Ecology and Etiology of Newly Emerging Marine Diseases. pp. 25–38. Springer, Dordrecht.
Bahr, K., Jokiel, P., & Toonen, R. 2015b. The unnatural history of Kaneohe Bay: Coral reef resilience in the face of centuries of anthropogenic impacts. PeerJ 3, e950
Benbasat, I. & Dexter, A.S. 1985. An experimental evaluation of graphical and color-enhanced information presentation. Management Science 31, 1348–1364.
Bolker, B.M., Brooks, M.E., Clark, C.J., Geange, S.W., Poulsen, J.R., Stevens, M.H.H. & White, J.S.S. 2009. Generalized linear mixed models: A practical guide for ecology and evolution. Trends in Ecology & Evolution 24, 127–135.
Brown, B.E. & Howard, L.S. 1985. Assessing the effects of “stress” on reef corals. Advances in Marine Biology 22, 1–63.
Cox. E. 1986. The effects of a selective corallivore on growth rates and competition for space between two species of Hawaiian corals. J Exp Mar Bio Ecol 101, 161–174.
Cox, E. 2007. Continuation of sexual reproduction in Montipora capitata following bleaching. Coral Reefs 26, 721–724.
Davis, E.M. 1977. Decision Making. pp 289–294.
Fisher, P.L., Malme, M.K. & Dove, S. 2012. The effect of temperature stress on coral-Symbiodinium associations containing distinct symbiont types. Coral Reefs 31, 473–485.
Gleason, D. 1993. Differential effects of ultraviolet radiation on green and brown morphs of the Caribbean coral Porites astreoides. Limnol Oceanogr 38, 1452–1463.
Gibson, R., Atkinson, R., Gordon, J., Smith, I. & Hughes, D. 2011. Impact of ocean warming and ocean acidification on marine invertebrate life history stages: Vulnerabilities and potential for persistence in a changing ocean. Oceanogr Mar Biol Annu Rev 49, 1–42.
Hughes, T.P., Baird, A.H., Bellwood, D.R., Card, M., Connolly, S.R., Folke, C., Grosberg, R., Hoegh-Guldberg, O., Jackson, J.B., Kleypas, J. and Lough, J.M. 2003. Climate change, human impacts, and the resilience of coral reefs. Science 301, 929–933.
Hughes, T.P. & Connell, J.H. 1999. Multiple stressors on coral reefs: A long-term perspective. Limnology and Oceanography 44, 932–940.
Innis, T., Cunning, R., Ritson-Williams, R., Wall, C.B. & Gates, R.D. 2018. Coral color and depth drive symbiosis ecology of Montipora capitata in Kāneʻohe Bay, Oʻahu, Hawaiʻi. Coral Reefs 37, 423–430.
Jokiel, P. 1987. Ecology, biogeography and evolution of corals in Hawaii. Trends in Ecology & Evolution 2, 179–182.
LaJeunesse, T.C., Thornhill, D.J., Cox, E.F., Stanton, F., Fitt, W.K. & Schmidt, G.W. 2004. High diversity and host specificity observed among symbiotic dinoflagellates in reef coral communities from Hawaii. Coral Reefs 23, 596–603.
Menge, B.A. & Sutherland, J.P. 1987. Community regulation: variation in disturbance, competition, and predation in relation to environmental stress and recruitment. The American Naturalist 130, 730–757.
Nevo, E. 2001. Evolution of genome–phenome diversity under environmental stress. Proceedings of the National Academy of Sciences 98, 6233–6240.
Putnam, H.M., Davidson, J.M., & Gates, R.D. 2016. Ocean acidification influences host DNA methylation and phenotypic plasticity in environmentally susceptible corals. Evolutionary Applications 9, 1165–1178.
Shore-Maggio, A., Callahan, S.M. & Aeby, G.S. 2018. Trade-offs in disease and bleaching susceptibility among two color morphs of the Hawaiian reef coral, Montipora capitata. Coral Reefs 37, 5-7–517.
Schneider, C.A., Rasband, W.S. & Eliceiri, K.W. 2012. NIH Image to ImageJ: 25 years of image analysis. Nature Methods 9, 671.
Schultz, J.K., Pyle, R.L., DeMartini, E. & Bowen, B.W. 2007. Genetic connectivity among color morphs and Pacific archipelagos for the flame angelfish, Centropyge loriculus. Marine Biology 151, 167–175.
Appendix A
Protocol in ImageJ
Optimizing the Procedure:
-
Open color corrected photo
-
Use the oval function and draw an oval on the fragment
-
Hit Edit>> Selection>> Specify. Ensure that ’constrain’ is on and that width and height are exactly the same. Make a perfect circle
-
Without clicking on the photo again hit Control B and draw a new circle. When done do not click on the photo, but hit Edit>> Selection>> Specify to make both circles the same dimensions (175 x 175)
-
Go to Image>> Overlay>> To ROI Manager
- It will number and highlight both circles
- Select the circle that the ROI Manager deems as circle #1 in the ROI Manage Tool Bar (on the left hand side) and press Add
-
This will create the same circle and provide a new number to this new circle
-
Click on the number in the middle of the circle and drag the circle to the desired spot on the fragment
-
Repeat step 6a and 6b until you have 10 circles equally distributed (by hand) across the coral
- Without exiting out of the ROI Manager Tool Bar click on the first circle (either in the ROI Manager Tool Bar or physically click on the circle’s number) and hit Plug-ins>> Compile and Run
-
Find the RGB_Measure.java file and hit enter
-
Do this for each circle by selecting the number either in the ROI Manager or by selecting the circle by clicking on the number in the circle
-
When all 10 of the circle’s data is complete go into the data tool bar and hit Ctrl A to select all and copy and paste it into an excel sheet
-
Repurpose the data accordingly on the excel sheet and clear the data in the data tool bar by not clicking in the data but by going to Edit>> Clear with all the data selected (Ctrl A if they happen to deselect)
-
Without exiting ROI Manager, individually slide the circles to the next desired locations and repeat steps 7 and 8 to get all data on one picture (data for each of the fragments in the picture)
-
When you are done gathering the data for one photo hit File>> Open Next to keep the circles on the photo and then you can slide them to where you would like and plug through steps 7-8.