Using protected area shape to model the impacts of hunting and access on the survival of an economically valuable species
Using protected area shape to model the impacts of hunting and access on the survival of an economically valuable species
Lorena Benitez, MESc 20201
Abstract
Protected areas often exist as habitat fragments within human-dominated landscapes, frequently resulting in negative consequences for populations of species that inhabit these fragments. The synergistic effects of hunting and fragmentation can be especially devastating for the persistence of vertebrates. This paper examines the relationship between protected area shape and hunting pressure on the survival of an economically valuable species, Temminck’s pangolin (Smutsia temminckii), through a mathematical model. Survival of the species was modeled using a population growth equation where carrying capacity was a function of area and death was reliant on a combination of poaching pressure and hunting access. The model revealed that even the most ideal protected area shape results in extinction assuming high poaching levels or the presence of a road, while less ideal shapes exacerbate the effects of poaching. This model suggests that conservation efforts need to better assess how protected areas are designed and what external pressures they are likely to face to ensure that biodiversity is maintained within their borders long term.
Introduction
Protected areas are an important tool in the global fight against biodiversity loss (Jenkins & Joppa 2009). They are defined by the International Union for the Conservation of Nature (IUCN) as “an area of land and/or sea especially dedicated to the protection and maintenance of biological diversity, and of natural and associated cultural resources, and managed through legal or other effective means.” While protected areas are designed with the goal of maintaining viable species populations, protected areas do not guarantee biodiversity protection (Brooks et al. 2004). This discrepancy is often because protected areas exist as habitat fragments within landscapes of various human land uses which result in negative consequences for ecological function within the protected areas (Hansen & Defries 2007). These negative impacts are the result of a combinations of human actions including, but not limited to fragmentation, hunting, agriculture, and resource extraction (Hansen & DeFries 2007; Joppa et al. 2008; Chazdon et al. 2009). While any of these anthropogenic disturbances can be devastating to biodiversity alone, synergistic interactions can double biodiversity loss (Barlow et al. 2016). This paper seeks to look at the synergistic effects of fragmentation and hunting on the survival of populations of an economically valuable vertebrate, Temminck’s pangolin.
The synergistic effects of hunting and fragmentation can be especially devastating for the persistence of vertebrate species (Peres 2001). Hunting is likely to drive populations of medium- and large-sized vertebrates to extinction in small habitat fragments (Peres 2001). Yet, it is not only fragment size that impacts species persistence but also the shape of those fragments (Ewers & Didham 2007). Fragments with more complex shapes have more area affected by edge effects and a smaller core area due to high perimeter to area ratios than fragments with simpler shapes (Laurance & Yensen 1991). Increased edges of fragments make access to the interior area easier, thus increasing hunting success. This issue is especially problematic as demographic and social changes to human settlements surrounding protected areas have led to increased hunting pressure in and around parks and reserves (Harrison 2013).
Mitigating the impacts of illegal hunting or poaching within protected areas relies on two types of factors: the sociocultural dynamics in the region and the ease of accessing wildlife. This paper focuses on the later by manipulating the shape of protected areas in terms of overall shape as well as location of roads and buffer zones. Roads are known to increase hunting pressure (Wilkie et al. 2000). The vast majority of poaching camps and snares are within 5km of a paved road (Clements et al. 2014). Conversely, buffer zones can decrease access to the interior of protected areas, thus limiting access to hunters. Buffer zones, or land peripheral to protected areas that remains largely intact, is a suggested method for reducing the impacts of human activity on protected areas (Hansen et al. 2011). This paper aims to illustrate how the shape of protected areas can exacerbate the influence of poaching on the survival of an economically valuable species. Understanding how these factors impact a species with a high level of vulnerability may serve as an early indicator of overall ecosystem health and potentially warn of future biodiversity loss.
Methods
Study Species
Pangolins (Order: Pholidota) are considered the one of world’s most trafficked mammals and receive global protection under Appendix 1 of the Convention on the International Trade of Endangered Species (Challender & Waterman 2017). They are important to local cultures throughout their range, as they are eaten and used in many traditional medicines (Challender et al. 2014; Soewu & Sodeinde 2015). Hunting of pangolins is intensified by multiple incentives. First, pangolins are a preferred and easy source of meat. Second, their scales are valuable after the meat has been consumed. Pangolin scales are sold on the black market because they are believed to have medicinal properties in some Asian cultures (Challender et al. 2014).
Temminck’s ground pangolin (Smutsia temminckii) is the most widely distributed pangolin species. It is found in savannah and woodlands throughout Eastern and Southern Africa (Heath 1992). They are an ideal species to use in this model because they have distinct home ranges, and no more than a single adult male and female will inhabit any one home range (Pietersen et al. 2014).
Smutsia temminckii home ranges vary in average size. Home-range size in Zimbabwe are 0.2–23.4 km² (Heath & Coulson 1997), while studies in South Africa report home ranges of 1.3–7.9 km² (van Aarde et al. 1990) and 6.5 ± 5.9 km² (Pietersen et al. 2014) for adult pangolins. The study model will use the most recently reported home-range size of 6.5 km² to estimate the maximum number of pangolins in a protected area (carrying capacity).
Juvenile pangolins must leave their mother’s territory, sometimes traveling up to 49 km from their mother’s home range, to establish their own (Pietersen at al. 2014). Juveniles travel great distances at a rapid pace during this dispersal phase. One juvenile reportedly traveled 36 km in eleven days (Pietersen et al. 2014), while another was recorded traveling 300 km in four months (van Aarde et al. 1990). Pangolins must disperse to breed, yet they are unlikely to venture into human-dominated areas. Pangolins have not been found in agricultural areas and places of dense human population (Coulson 1989). More work is required to assess whether this absence is a result of increased hunting or the pangolin’s preference to avoid human-dominated areas.
Equation
To assess the persistence of pangolins in a theoretical protected area, a model was created using population viability and survivorship. These can be assessed using a population growth model. In this model, a population fluctuates between population sizes of zero and K, which represents the carrying capacity of the population. The population either goes to extinction, fixes at the carry capacity, or remains constant dependent upon the growth rate, r (Eq. 1).
 (Eq. 1)
The equation can be manipulated so that carrying capacity is a reflection of available habitat. Pangolin numbers are constrained by available habitat, which is defined by the protected area in this model. In this system, it becomes increasingly difficult for juvenile pangolins to find unoccupied territory to make their home range as the population increases to near the carrying capacity (K). Because of this, they are likely to leave the protected area in search of unoccupied habitat. Leaving the system is synonymous with death, as it drastically increases the likelihood of encountering opportunistic poachers. Thus, the carrying capacity of a protected area is directly related to the amount of available habitat within the system. This can be represented as a ratio of the area where a pangolin is likely to survive (a) divided by the average amount of space an individual is likely to claim as their territory, or the home range size (h) (Eq 2):
![]() (Eq. 2)
(Eq. 2)
While area may constrain pangolin population numbers, few other factors impede their population growth. They have few natural predators, with only a few cases of pangolins ever being eaten by large carnivores. Even lions are unable to kill pangolins when they roll into a protective ball. Their main cause of death is therefore poaching. All other causes of death can be assumed to be negligible. These life history characteristics are factors that impact the growth rate, r. The growth rate is change in growth rate of the population after a birth and death cycle. It is represented by the following equation (Eq. 3):
![]() (Eq. 3)
(Eq. 3)
The reproductive factor (R) represents the number of surviving individuals per parent where b is per capita number of births and d is per capita number of deaths. For the purposes of this model, an offspring is not assumed to exist in the population until it has found a territory to occupy.
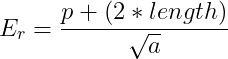
The number of pangolins that die (d) can be represented by the likelihood of a pangolin encountering a poacher in the protected area. It is assumed that if a poacher encounters a pangolin, the pangolin will die. Two main factors contribute to this likelihood: access to the protected area and the frequency of poachers in the protected area. Access is important because it determines where in the protected area people can enter and how far into the protected area they can penetrate. A greater number of access points means that a greater proportion of area can be used as a poaching ground. Fewer access points mean that there are more places that pangolins can remain undetected (refugia). If access is so great that there are no refugia, then the population goes to extinction. Access for this equation is represented by the edge factor (E), which is a function of the perimeter (p) of the protected area divided by the square root of the area (a) (Eq. 4):
 (Eq. 4)
Pangolin deaths (d) is a function of the edge factor (E) and the frequency of poachers in the protected area. The frequency of poachers in the protected area is represented in this equation by the poaching factor (f). This number is a culmination of several social factors that could contribute to increased likelihood of encountering a pangolin such as number of people poaching and the amount of time spent poaching. The poaching factor ranges from 0 to greater than 1, with 0 representing no poaching in the protected area. The poaching factor is a metric of hours spent poaching divided by the total hours available to the population N0. This range allows the poaching factor to increase exponentially with human population size to reflect changes in the surrounding area over time (Eq. 5).
![]() (Eq. 5)
(Eq. 5)
The edge factor (E) and poaching factor (f) combined equal the likelihood of a pangolin being poached and can replace death in the growth rate equation. The birth rate does not change (Eq. 6)
![]() (Eq. 6)
(Eq. 6)
The growth rate equation above (Eq. 6) can then be substituted into the logistic growth equation (Eq. 1) along with the modified carrying capacity (Eq. 4) to create the final equation for this model (Eq. 7).
 (Eq. 7)
There are assumptions made to simplify the model (Table 1a). For this model, the unit of time is a year. Within this year, all births and deaths are assumed to occur at the same time, with births occurring prior to deaths. Birth and death rates remain constant and all individuals reproduce with the same likelihood. Additionally, the population in this equation contains only females, as they are the only individuals giving birth. Additionally, female pangolins are not known to have overlapping home ranges, which further supports the use of area to determine carrying capacity (Pietersen et al. 2014). Further assumptions about the growth rate are that individuals are assumed to die if they leave the protected area. This simplifies the model so that migration does not need to be included as a variable.
Table 1. The model is based on assumptions about both the population of pangolins being modeled and the protected area. These assumptions simply the model, so that the dynamics of poaching and access are the only independent variables.
| (a) Pangolin | (b) Protected Area |
|---|---|
| 1. All births and deaths are assumed to occur at the same time with births occurring prior to the deaths | 1. The only way to access the protected area is by crossing the perimeter |
| 2. The equation only includes females | 2. Roads increase access and thus the perimeter |
| 3. Individuals die if they leave the protected area | 3. The protected area is greater than the home range of a single individual (a > H) |
| 4. Birth and death rates are constant | 4. Habitat is homogenous throughout |
| 5. All individuals have an equal likelihood of reproducing | 5. Roads do not change the area |
| 6. All individuals reproduce |
The model also makes assumptions about the protected area. The first is that the only way to access the interior of the protected area is by crossing the perimeter at ground level. Entrance to the protected area from a helicopter or airplane are not considered because they would not be advantageous for poaching pangolins. Roads accessible to vehicles increase the access points (perimeter) as they increase the likelihood that poachers will be able to reach otherwise interior portions of the protected area. Because the roads represent only a small portion of the overall area, their area is negligible. An additional constraint is that the protected area is greater than the home range of a single individual (a > H). A protected area smaller than the size of a single home range would mean that it is unable to sustain a population.
Numerical Experiments
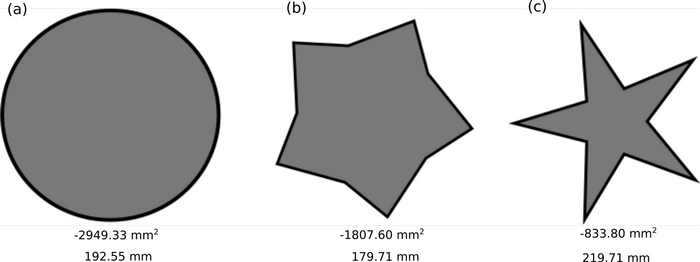
Fig. 1. The three example protected area geometries, where (a) is the ideal shape to minimize the perimeter to area ratio (b) is a less optimal geometry and (c) is the least optimal geometry having the highest edge factor. The area and perimeter are labeled below the shape. The shapes are to scale (1mm:1km).
To test this model, three shapes with different geometries were generated to represent protected areas (Fig. 1). The circle has the lowest perimeter to area ratio and the smallest possible edge factor (E = 3.55). It thus represents the ideal protected area shape.
 (Eq. 8)
The other two protected area shapes represent less optimal designs that have greater edge factors (Fig. 1 b and c). The shapes also represent decreasing areas (Table 2) to be consistent with the effects of habitat degradation or loss and can be viewed as a progression through time with Fig. 1a being the original area and figures 1b and 1c as worsening degradation.
Table 2. The area, perimeter and calculated edge factor for the three protected area geometries from Fig. 1.
| Shape | Area (km²) | Perimeter (km) | Edge Factor () |
|---|---|---|---|
| a | 2949.33 | 192.55 | 3.55 |
| b | 1870.6 | 179.77 | 4.16 |
| c | 833.8 | 219.71 | 7.61 |
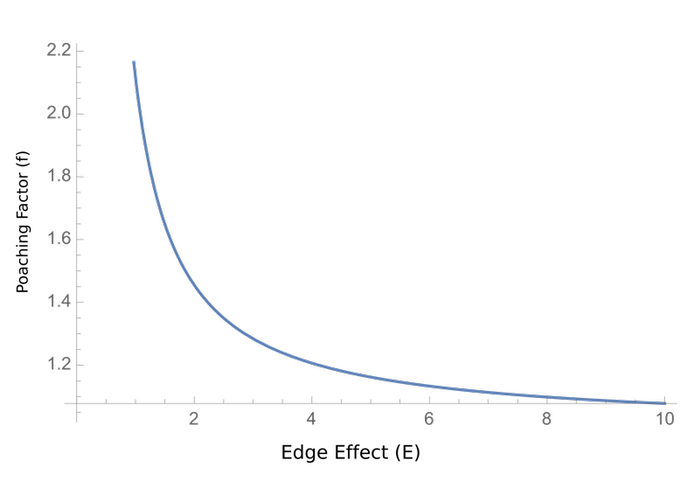
Fig. 2. The relationship between edge factor and poaching factor that results in the constant reproductive rate to being equal to zero when the birth rate is 0.75.
The area and edge factor of the three protected area geometries were used to calculate how a population of pangolins would survive in the area under different levels of poaching. Low poaching was represented as f = 0.05. Medium poaching was f = 0.15, and high poaching f = 0.30. The initial starting population size was n = 4. A small initial population size was chosen because it shows rapidly how edge factors and poaching can affect a population. The birth rate was set at a constant of 0.75. All calculations and graphing were conducted using the software Mathematica (Wolfram Research Inc 2020).

Fig. 3. Examples of road disturbances that impact the edge factor of the three polygons from Fig. 1 with the perimeter of each section labeled.
Lines of varying lengths were added to the shapes to test the impact of roads on survival of the species (Fig. 3). Roads increase access to the interior of the protected area, so they were incorporated into the edge factor. The roads were added to the perimeter. The length was doubled as access to the interior is possible from both sides of the road. For this model, the area does not change with the addition of the road.
 (eq. 9)
The roads were made either to bisect the shape as an example of the worst possible straight road (Fig. 3a, c, f) or from vertex to vertex to connect where settlements are most likely to be close to the protected area (Fig. 3b, d, e, g).
Conversely, the model allows for testing how increasing the size of the protected area through a variety of buffer zones impacts access. A variety of buffer zones were created for the shape with the highest edge factor to change the area to perimeter ratio (Fig. 4). One represents a buffer zone that encompasses the entire protected area (Fig. 4a). The other two do not protect all borders but require less additional area be added to the shape.

Fig. 4. Potential buffer options for shape c from Figure 1. (a) represents a buffer zone that encompasses the entire protected area (b) and (c) are alternative methods that do not protect all borders but require less additional area.
Results
The impact of poaching and edge factors was assessed by examining whether the population reached carry capacity or became extinct under the specified conditions. To avoid extinction, the rate of change (rc) must be positive or zero. When rc is equal to zero the population size does not change, and the birth rate is equal to the death rate.
 , where rc = b − d (eq. 10)
The relationship between edge and poaching factors allows them to compensate for each other so that the population persists. For example, a low poaching factor can compensate for a high edge factor. For a poaching factor of 1, the edge factor would have to be less than 0.75 for a population of pangolins to persist. For shape with the lowest edge factor (E = 3.55), the poaching factor would have to be less than 0.21 for the protected area to maintain a population of pangolins. The poaching factor drops to 0.18 for the less optimal protected area and 0.10 for the least optimal option (Table 2).
The carrying capacities of the protected areas were 454, 288, and 128 for the protected areas a, b, and c, respectively (Fig. 1). All three geometries have their population reach the carrying capacity under low levels of poaching, but all populations went to extinction under high poaching (Fig. 5). Only the least optimal protected area geometry went extinct under medium poaching.
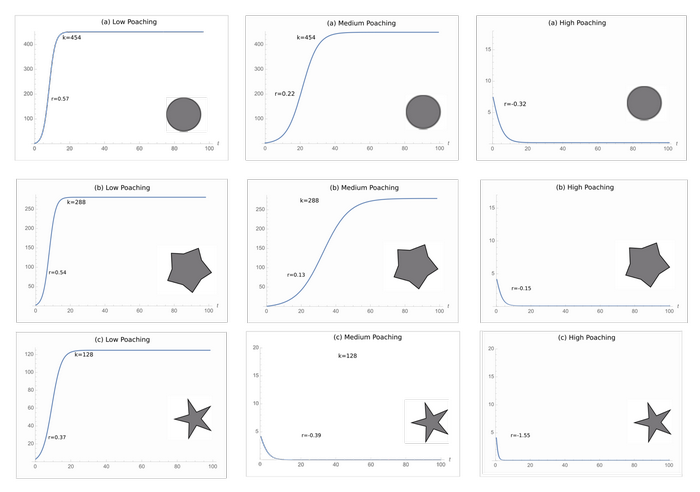
Fig. 5. The logistic growth curves of each protected area geometry under low, medium, and high poaching. The ideal geometry (a) goes to extinction at high poaching just like the intermediate (b) and least ideal (c) geometries.
The addition of roads impacts the survival of the species for two of the three protected area geometries. Bisecting the circular protected area creates the greatest increase in edge factor with a 63% increase (Table 3). Bisecting the second polygon results in a similarly high 56.2% increase, while the least optimal polygon only increases 35.6% in edge factor when bisected (Table 3). Overall, the least-optimal protected area shows the lowest increase in edge factor when two of its vertices are connected, but it still maintains the highest edge factors of the three polygons. This increase in access changes the trend in pangolin survivorship. At low poaching levels, the addition of a road does not lead to extinction, but at medium levels, all the shapes result in extinction regardless of road length (Figures 6, 7, and 8).
Table 3. The area, perimeter and calculated edge factor for the protected area geometries from Fig. 5.
| Shape | Area (km²) | Perimeter (km) | Edge Factor () | Increase in Edge Factor (%) |
|---|---|---|---|---|
| a | 2949.33 | 313.93 | 5.78 | 63.0 |
| b | 1870.60 | 226.89 | 5.24 | 26.2 |
| c | 1870.60 | 280.78 | 6.49 | 56.2 |
| d | 1870.60 | 258.54 | 5.98 | 43.8 |
| e | 833.80 | 256.85 | 8.89 | 16.9 |
| f | 833.80 | 297.90 | 10.31 | 35.6 |
| g | 833.80 | 241.90 | 8.38 | 10.1 |
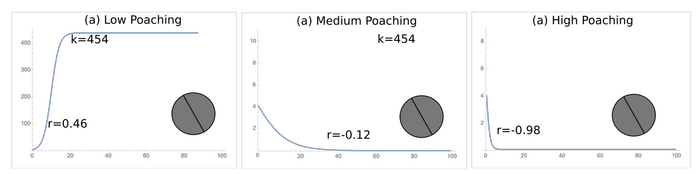
Fig. 6. The logistic growth curves of protected area geometry under low, medium, and high poaching for shape a from Fig. 4.
The addition of buffer zones to the protected area decreases the edge factor of the worst shape but did not change the edge factor enough to rescue the population under medium levels of poaching. For the buffer that encompassed the entire shape (Fig. 4a), the edge factor effectively did not change (decreased by 0.01). The buffer depicted in Fig. 4b has the smallest increase in area, but the perimeter is still relatively long. It has an edge factor of 6.75 (compared to 7.61 without the buffer). The last buffer option (Fig. 4c) results in an increase in area that is between the other two options, but the least increase in perimeter. The edge factor for this geometry is 5.65, which is a 1.96 decrease. Despite these decreases, the population still would not persist without lowering the poaching factor. At medium poaching, the edge effect would need to be lower than five for the population to survive.
A

Fig. 7. The logistic growth curves under low, medium, and high poaching for Fig. 4b–d.
Discussion
This model demonstrates that the shape of a protected area fragment has a strong influence on how outside forces, in this case poaching, can impact populations of species that reside on land that is “protected”. Even models with ideal geometry result in extinction under high poaching levels or the addition of a road. Thus, conservation practitioners need to better assess how protected areas are designed to ensure that they can maintain biodiversity in the long-term. One way of doing this is the inclusion of buffer zones. Yet when buffer zones were included in this model, they failed to rescue the population under moderate levels of poaching. Thus, achieving success of protected areas means integrating landscape planning (shape and roads) with sociocultural factors (hunting pressure).
Edge and poaching factors in the model are not easily defined to reflect specific field site dynamics, thus applying this model to conservation efforts is complex. In the model, edge factor refers to access to the interior of the protected area and is defined by any border. In the field, this line is often ambiguous due to the presence of fences, guards, or other forms of barriers. Yet it is difficult to define “accessibility” empirically in the model. For example, rivers can be interpreted in a variety of ways. Are they a barrier or an access point because they can be used for transportation? Furthermore, man-made barriers like fences may degrade over time and no longer act as a barrier. Defining access via a perimeter is highly specific to the region being analyzed.
A
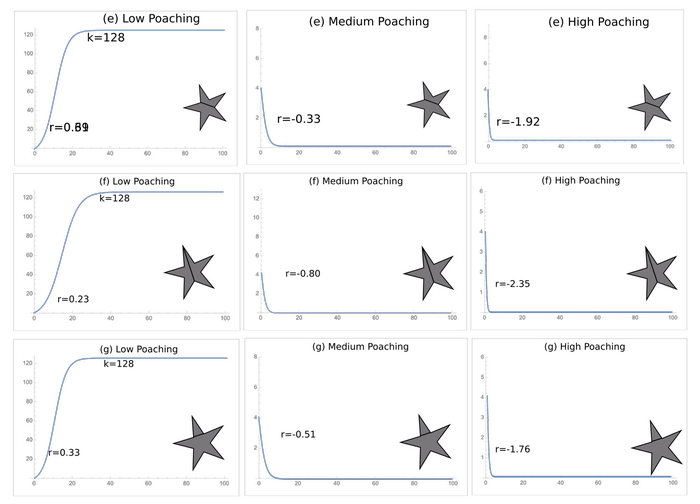
Fig. 8. The logistic growth curves under low, medium, and high poaching for Fig. 4e–g.
The model also implicitly assumes that the perimeter is equally accessible along its length even without barriers that make entrance impossible. Differences in vegetation and geography may make some regions more easily accessible than others. This model is flexible enough to incorporate empirical data based on site specific concerns. The perimeter can be redefined to include these variations into the variable, p. Fences, trenches, rivers, or monitored borders can be considered inaccessible and that portion of the perimeter subtracted from p.
For the purposes of this model, protected areas exist as closed systems. In the field, the success of fragments is dependent on other nearby habitat patches. Thus, the model must take into account complex boundaries and landscape heterogeneity. While map borders and other political designations can be used to model protected areas as the borders, these designations do not always represent the ecological system borders. However, political boundaries increasingly represent physical borders because development often extends to the edge of protected areas.
The considerations mentioned thus far have related to the edge factor. Yet, the poaching factor has an equal effect on the survival of pangolins in this model. Calculating the poaching factor may be even more difficult to correctly quantify because it is largely a measure of sociocultural and economic dynamics on local, regional, and even international scales. For example, availability of alternative food sources may impact how frequently someone relies on hunting for food or income.
Cultural factors are equally important to consider when calculating the poaching factor. Throughout their range, pangolins have different mythologies and significance associated with them (Boakye et al. 2014, 2016). In some regions of Namibia, pangolins are believed to have diamonds in their stomachs. In other regions, some people believe eating them will bring you wealth. In Uganda, pangolins are recognized as one of many possible personal totems. People whose totem animal is a pangolin must honor them and cannot kill or consume them. Pangolins are an important source of bushmeat in Western and Central Africa, but consumption of pangolins is less common in Eastern and Southern Africa. Understanding how different cultures interact with species is one aspect that could be incorporated into the likelihood of poaching.
Buffer zones could potentially impact both poaching and edge factors if planned with local communities in mind. Buffer zones provide access to protected areas, they just make it harder to get to park interiors, where habitat is likely to be higher quality and animals are more likely to inhabit. They may or may not reflect the vegetation of the protected area to which they are adjacent, and can be formed through natural regeneration, planting of native plants, or even certain forms of agriculture. Tea plantations have recently begun to be planted around protected areas in East Africa as an unpalatable buffer crop that provides monetarily for the local community, while also decreasing risks associated with other crops (Kinoti & Mwende 2019). A major issue between communities and protected areas is human-wildlife conflict, the most common conflict being crop raiding. Because of the economic and safety benefits of tea plantations (animals will not raid tea), the benefits of the buffer zone not only decrease the edge factor, but potentially decrease the poaching factor.
Protected areas play an important role in biodiversity conservation, but to protect species from these rapidly increasing threats, protected areas need to function more efficiently and inclusively. Theoreticians and practitioners should recognize that the health of a protected areas is tied irrevocably to its geographic, social, and cultural context. Minimizing the components that contribute to edge and poaching factors is crucial for the ability of protected areas to maintain biodiversity of keystone species over time. Yet, mitigating these contributing factors is only becoming more difficult. By 2050, 25 million km of new paved roads are projected to be built with the majority in tropical countries (Dulac 2013). In Africa, 53,000 km of “development corridors” are set to be created with several going directly through the Congo (Laurance et al. 2015). This development is a direct threat to the persistence of biodiversity both outside and within protected areas and further work is needed to understand how these threats work synergistically to exacerbate pressures on threatened species.
References
Barlow, J. et al. 2016. Anthropogenic disturbance in tropical protected areas can double biodiversity loss from deforestation. Nature 535, 144.
Boakye, M.K. et al. 2016. Unravelling the pangolin bushmeat commodity chain and the extent of trade in Ghana. Human Ecology 44, 257-264.
Boakye, M.K. et al. 2014. Ethnomedicinal use of African pangolins by traditional medical practitioners in Sierra Leone. Journal of Ethnobiology and Ethnomedicine 10, 76.
Boakye, M.K. et al. 2015. Knowledge and uses of African pangolins as a source of traditional medicine in Ghana. PLOS ONE 10, e0117199.
Brooks, T.M. et al. 2004. Coverage provided by the global protected-area system: is it enough? AIBS Bulletin 54, 1081-1091.
Challender, D. & C. Waterman. 2017. Implementation of CITES Decisions 17.239 B) and 17.240 on Pangolins (Manis* spp.). Prepared by IUCN for the CITES Secretariat*. SC69 Doc, 57.
Challender, D.W.S. et al. 2014. Scaling up pangolin conservation. IUCN SSC pangolin specialist group conservation action plan. In Zoological Society of London.
Chazdon, R.L. et al. 2009. Beyond reserves: A research agenda for conserving biodiversity in human‐modified tropical landscapes. Biotropica 41, 142-153.
Clements, G.R. et al. 2014. Where and how are roads endangering mammals in Southeast Asia’s protected areas?. PLOS ONE 9, e115376.
Coulson, I. 1989. The pangolin {Manis temmincki Smuts, 1835) in Zimbabwe. African Journal of Ecology 27, 149-155.
Dulac, J. 2013. Global Land Transport Infrastructure Requirements. Paris: International Energy Agency 20, 2014.
Ewers, R.M. & R.K. Didham. 2007. The effect of fragment shape and species’ sensitivity to habitat edges on animal population size. Conservation Biology 21(4), 926-936.
Hansen, A.J. et al. 2011. Delineating the ecosystems containing protected areas for monitoring and management. Bioscience 61, 363-373.
Hansen, A.J. & R. DeFries. 2007. Ecological mechanisms linking protected areas to surrounding lands. Ecological Applications 17, 974-988.
Harrison, R.D. et al. 2013. Consequences of defaunation for a tropical tree community. Ecology Letters 16, 687-694.
Heath, M. & I.A.N. Coulson. 1997. Home range size and distribution in a wild population of Cape pangolins, Manis temminckii, in north‐west Zimbabwe. African Journal of Ecology 35, 94-109.
Heath, M.E. 1992. Manis temminckii. Mammalian Species 415, 1-5.
INTERPOL. 2012. Environmental Crime. Available from http://www.interpol.int/Public/EnvironmentalCrime/Default.asp.
Jenkins, C.N. & L. Joppa. 2009. Expansion of the global terrestrial protected area system. Biological Conservation 142, 2166-2174.
Joppa, L.N. et al. 2008. On the protection of “protected areas”. PNAS 105, 6673-6678.
Kinoti, K.D. & K.M. Mwende. 2019. Spatial-Temporal Assessment of Forest Rehabilitation along Mt. Kenya East Forest Buffer Zone Using Remote Sensing and GIS. International Journal of Environmental Planning and Development 5, 6-16.
Laurance, W.F. et al. 2015. Estimating the environmental costs of Africa’s massive “development corridors”. Current Biology 25, 3202-3208.
Laurance, W.F. & E. Yensen. 1991. Predicting the impacts of edge effects in fragmented habitats. Biological Conservation 55, 77-92.
Peres, C.A. 2001. Synergistic effects of subsistence hunting and habitat fragmentation on Amazonian forest vertebrates. Conservation Biology 15, 1490-1505.
Pietersen, D.W. et al. 2014. Home range, habitat selection and activity patterns of an arid-zone population of Temminck’s ground pangolins, Smutsia temminckii. African Zoology 49, 265-276.
Soewu, D.A. & O.A. Sodeinde. 2015. Utilization of pangolins in Africa: fuelling factors, diversity of uses and sustainability. International Journal of Biodiversity and Conservation 7, 1-10.
van Aarde, R.J. et al. 1990. Report on the Behavioural Ecology of the Cape pangolin (Manis temminckii). Mammal Research Institute, University of Pretoria. Internal Report.
Wilkie, D. et al. 2000. Roads, development, and conservation in the Congo Basin. Conservation Biology 14, 1614-1622.
Wolfram Research, Inc. 2020. Mathematica. Version 12.1. URL: https://www.wolfram.com/mathematica.
Citation
Benitez, L. 2020. Using protected area shape to model the impacts of hunting and access on the survival of an economically valuable species. Tropical Resources, 39, 00–00.
-
(Not provided)↩︎