A survey of seedling herbivory in a Neotropical rain forest in Yasuní National Park, Ecuador
A survey of seedling herbivory in a Neotropical rain forest in Yasuní National Park, Ecuador
Jasmine Liu, BS Ecology & Evolutionary Biology, Yale College1
Introduction
Herbivory, particularly by feeding insects, has long exerted a strong selective pressure on plants (Ehrlich & Raven 1964). This pressure is apparent in the wide array of defense mechanisms that has arisen on account of relationships between plants and their natural enemies through evolutionary time (Agrawal & Fishbein 2006). Particularly at the vulnerable seedling stage, herbivory is among the most common sources of mortality (Bagchi et al. 2014), which in turn shapes forest communities (Janzen 1970). Here, I briefly present the results of a large-scale survey of herbivory in the seedling community of a Neotropical ever-wet forest at Yasuní National Park, Ecuador.
Methods
Fieldwork was conducted in Yasuní National Park in the Ecuadorian Amazon. The Yasuní Forest Dynamics Plot (FDP, 0°41′ S, 76°24′ W), is a 50-ha forest plot in which all trees have been mapped, marked, and identified (Valencia et al. 2004). The FDP was established in 1995 by the Pontifica Universidad Católica del Ecuador (PUCE), the Smithsonian Tropical Research Institute, Panama, and the University of Aarhus, Denmark (Valencia et al. 2004). This evergreen lowland terra firme wet forest occurs in an aseasonal climate with a mean annual rainfall of 3081 mm and no month regularly with <100 mm (Valencia et al. 2004) and temperatures averaging 24 to 27°C for all 12 months (Pitman 2000).
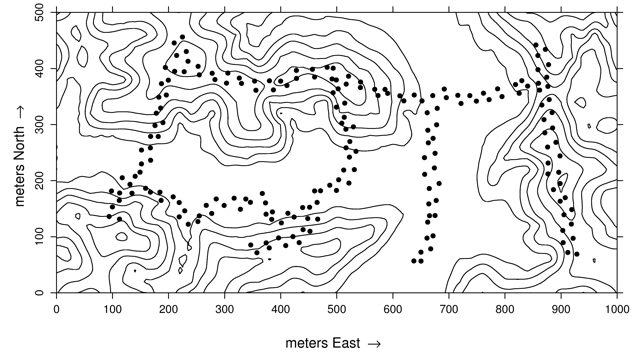
Fig. 1. Topographical map of the 50-ha Yasuní Forest Dynamics Plot. Black dots mark the location of seed traps, around each is three seedling plots. From Metz et al. (2010).
Within the FDP, a network of 600 1-m2 seedling plots was established in 2001 and a census of all seedlings in the 600 plots is carried out each summer (Figure 1; Metz et al. 2010). Three plots are associated with each of 200 seed traps in the FDP (Metz et al. 2010). Each set of three plots and its adjacent seed trap make up one census station, and stations are placed every 13.5 m along the trails. Each census station is some random distance between 4 and 9 m from the trail and on alternating sides of the trail (Figure 2; Metz et al. 2010).

Fig. 2. Schematic of seedling plots (green) relative to seed traps (blue) and trail (brown). From Metz et al. (2010).
Between May and August 2019, all seedlings between 5 cm and 150 cm in height within the 600 plots were surveyed for herbivory at the individual leaf level, with the exception of seedlings for which age is unknown (i.e. seedlings present at the time of the first census of the plots, greater than 18 years old). All cotyledons are excluded. The dataset presented here contains only seedlings over one year old and that were first marked and tagged in 2018 at the latest. In total, there are 1,067 species and 3,910 seedlings represented in this dataset, with a total of 29,016 leaves. Area loss on each leaf was estimated visually as a percentage of total area lost (Johnson et al. 2016) at a single point-in-time value of standing herbivory. Specifically, values for percent area loss was scored as one of seven bins: no damage, <5% lost, 5–25% lost, 25–50% lost, 50–75% lost, >75% lost, and entire leaf lost. The final bin was included to partially compensate for standing herbivory underestimating herbivore damage, particularly when entire leaves are lost at once. A leaf was placed in the final category of entire leaf lost when it was apparent that a leaf was lost to herbivore damage, such as when only a part of a petiole remained. Compared to finer-resolution methods, such as image analysis, visual estimation was much quicker and consequently allowed for a considerably larger sample size; in this case, every leaf on all surveyed seedlings was able to be scored for herbivore damage.
Results and Discussion
Number of leaves
There was a wide range in the number of leaves from plot to plot (Figure 3). Whereas several plots contained no seedlings and as a result, no leaves, the plots with the most leaves contained 537 leaves, followed by 434 leaves and 303 leaves for the plots with the second and third-highest leaf counts. Among plots with seedlings, the mean number of leaves was 50.11 and the median 39.
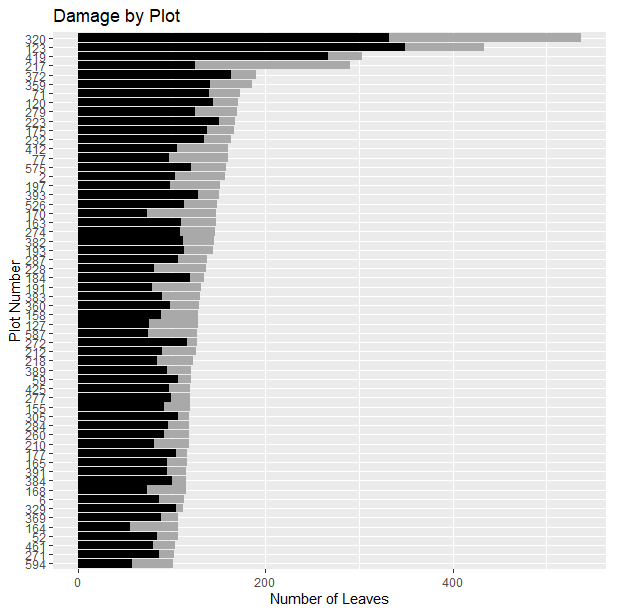
Fig. 3. Variation in plot-level herbivory. Black bars represent leaves that have sustained herbivore damage and grey bars represent leaves without damage. Only plots with >100 leaves are shown.
The species with the most leaves included Inga auristellae (1146 leaves, or 3.95% of all leaves in set), Inga oerstediana (920 leaves, or 3.17%), and Faramea quinquefolia (811 leaves, or 2.80%) (Figure 4). Genera with the most leaves included Inga (3748 leaves, or 12.992% of all leaves in set), followed by Piper (1448 leaves, or 4.99%), Pseudolmedia (938 leaves, or 3.23%), Faramea (916 leaves, or 3.16%), and Miconia (873 leaves, 3.01%) (Figure 5). The family with the most leaves was Fabaceae (5540 leaves, or 19.09% of all leaves in set), in part driven by the commonness its constituent genus Inga. Moraceae (2484 leaves, or 8.56%) had the next highest leaf count, followed by Rubiaceae (1838 leaves, or 6.33%), Piperaceae (1448 leaves, or 5.12%), Myristicaceae (1330 leaves, or 4.58%), and Melastomataceae (1225 leaves, or 4.22%). These six families with the highest leaf counts together accounted for 47.78% of all leaves in the dataset.
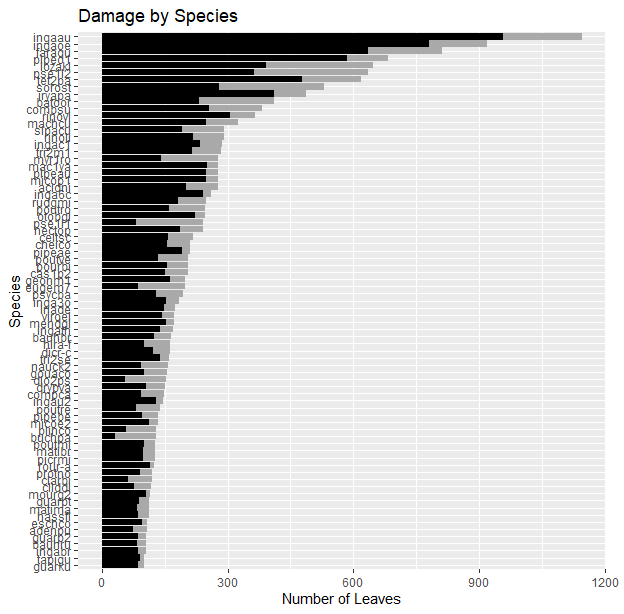
Fig. 4. Variation in species-level herbivory. Black bars represent leaves that have sustained herbivore damage and grey bars represent leaves without damage. Only species with >100 leaves are shown.
Herbivory: seedling level
A total of 6711 leaves (or 23.77% of the full set) suffered no damage, and 21514 leaves had some form of damage. The observed distribution of herbivore damage was similar to a previous large-scale survey of herbivore damage in seedlings of a Neotropical wet forest, which found 41% of surveyed leaves intact (de la Cruz & Dirzo 1987). Differences may be driven in part by sampling—de la Cruz & Dirzo sampled only two leaves per plant on 52 species.
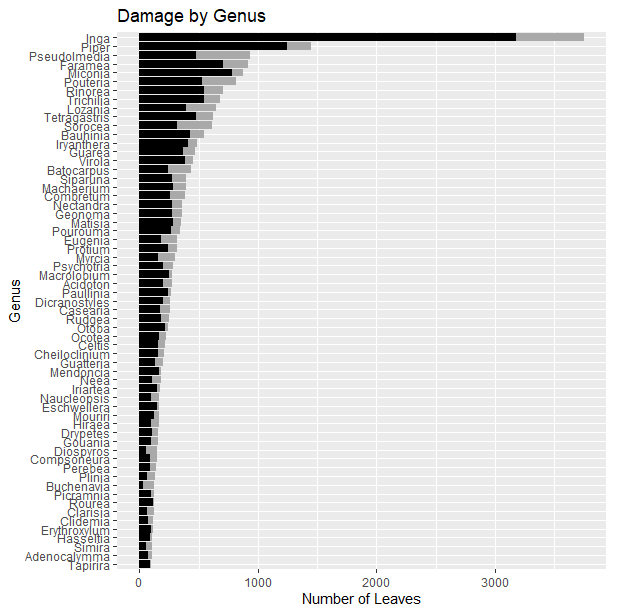
Fig. 5. Variation in genus-level herbivory. Black bars represent leaves that have sustained herbivore damage and grey bars represent leaves without damage. Only genera with >100 leaves are shown.
Among leaves with damage, 7148 leaves (25.32%) lost between 0 and 5% of total leaf area, 5763 leaves (20.42%) lost between 5 and 25%, 4929 leaves (17.46%) lost between 25 and 50%, 2364 leaves (8.38%) lost between 50 and 75%, 1148 leaves (4.07%) lost between 75 and 100%, and 162 leaves (0.57%) lost the entire leaf blade (Figure 6).
Overall, the herbivore damage observed in the Yasuní FDP appeared to be typical for a tropical wet forest. De la Cruz & Dirzo’s 1987 survey of seedling herbivory found an average standing herbivore damage level of 9.3%. Herbivore damage on all forest trees—adults included—may still be higher. In summarizing the results of 21 studies, Barone & Coley (1996) determined an average herbivory rate of 11.1% per year among shade-tolerant species. Though annual herbivory rate is not directly comparable to standing herbivory, all seedlings in the present study are greater than one year old (median age is 3 years), implying that the observed accumulated damage would be predicted to be much greater than 11% based on herbivory rate estimates from all age classes.
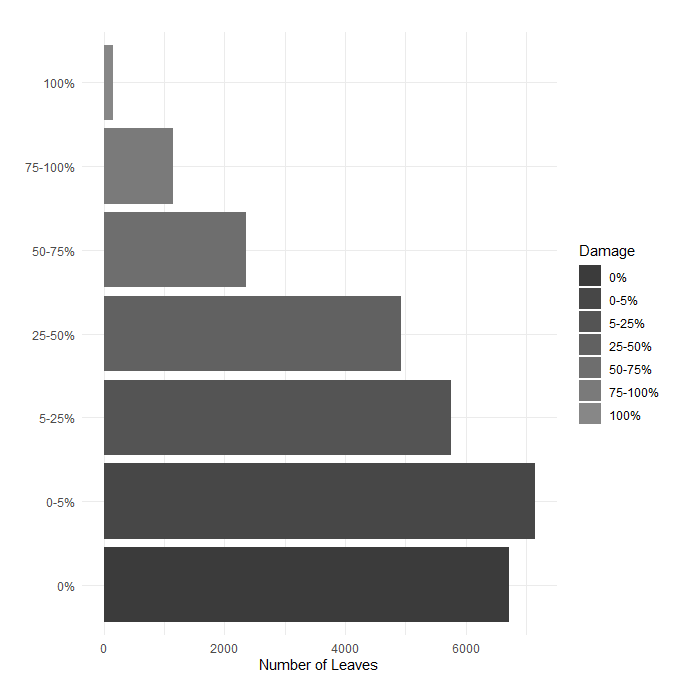
Fig. 6. Leaf-level herbivory. All leaves surveyed for herbivory by damage bin. Percent area loss to herbivory is shown increasing moving upwards along the y-axis.
In context, even seemingly small proportions of leaf area loss can have ecological implications for seedlings. In Dipteryx panamensis seedlings, for instance, mortality increases from 15% for seedlings without damage to 100% with an 8% loss of leaf area (Clark & Clark 1985).
Herbivory: species and genus levels
The proportion of leaves showing area loss to herbivory varies considerably both from species to species and among genera (Figures 4 & 5). Leaves on seedlings of the genus Inga (Fabaceae), one of the most common genera in the FDP, suffered more herbivore damage compared to the mean of all leaves, with only about 15% of Inga leaves not damaged. Differences are likely driven in part by the variety of strategies evolved under herbivore pressure, with some taxa investing in defense and others on tolerance to herbivory or ability to outgrow sustained damage, for instance (Agrawal & Fishbein 2006).
Conclusion
Herbivory was surveyed in the seedling community of a Neotropical wet forest at the leaf level. In general, the level of leaf area loss to herbivory showed a right-skewed distribution, with many leaves accumulating less than 25% area loss and comparably few having lost more than 75%. Furthermore, damage varied considerably by species and genus, as well as among seedling plots. The observed levels of leaf area loss are expected to have significant ecological consequences, though further work is needed to explicitly link damage with future growth and mortality.
Acknowledgements
There are many people without whom this project would never have been possible. I owe my sincerest thanks to Dr. Margaret Metz, who generously allowed me the use of her seedling plots as well as borrow the time and efforts of several of her lab members. Dr. Nancy Garwood allowed me access to her seedling herbarium and Dr. Renato Valencia the use of the Yasuní Forest Dynamics Plot. I am also indebted to my two wonderful field assistants, Sofía Montalvo and Letícia Bulascochi Cagnoni, who both worked tirelessly in the field and were constant sources of energy and joy at the station.
Finally, I thank my advisor, Dr. Simon Queenborough, both for introducing me to the strange and wonderful world of tropical ecology and for providing grounded guidance from project inception to present.
Funding for this project was provided by the Yale Tropical Resources Institute, Yale Alan S. Tetelman Fellowship for International Research in the Sciences, as well as the Benjamin Franklin College Richter Summer Fellowship.
References
Agrawal, A.A. and Fishbein, M. 2006. Plant defense syndromes. Ecology 87, S132–S149.
Bagchi, R., Gallery, R.E., Gripenberg, S., Gurr, S.J., Narayan, L., Addis, C.E., Freckleton, R.P., and Lewis, O.T. 2014. Pathogens and insect herbivores drive rainforest plant diversity and composition. Nature 506, 85–88.
Clark, D.B. and Clark, D.A. 1985. Seedling dynamics of a tropical tree: impacts of herbivory and meristem damage. Ecology 66, 1884–1892.
Coley, P.D. and Barone, J.A. 1996. Herbivory and plant defenses in tropical forests. Annual Review of Ecology and Systematics 27, 305–335.
de la Cruz, M. and Dirzo, R. 1987. A survey of the standing levels of herbivory in seedlings from a Mexican rain forest. Biotropica 19, 98–106.
Ehrlich, P.R. and Raven, P.H. 1964. Butterflies and plants: a study in coevolution. Evolution 18, 586–608.
Janzen, D.H. 1970. Herbivores and the number of tree species in tropical forests. The American Naturalist 104, 501–528.
Johnson, M.T., Bertrand, J.A., and Turcotte, M.M. 2016. Precision and accuracy in quantifying herbivory. Ecological Entomology 41, 112–121.
Metz, M.R., Sousa, W.P., and Valencia, R. 2010. Widespread density-dependent seedling mortality promotes species coexistence in a highly diverse Amazonian rain forest. Ecology 91, 3675–3685.
Pitman, N.C.A. 2000. A large-scale inventory of two Amazonian tree communities. Doctoral dissertation, Duke University.
R Core Team 2019. R: A language and environment for statistical computing. R Foundation for Statistical Computing, Vienna, Austria.
Citation
Liu, J. 2020. A survey of seedling herbivory in a Neotropical rain forest in Yasuní National Park, Ecuador. Tropical Resources 39, 00–00.
-
Jasmine is a recent graduate of Yale College (BF 20), with a BS in ecology and evolutionary biology. She is currently working on a master’s in tropical biodiversity and ecosystems in Belgium and hopes to return to the tropics in the spring.↩︎